shiny Applications


Grayson White

Math 241
Week 6 | Spring 2026

Week 6 Goals

Mon Lecture

  • Introduction to shiny applications
  • Get Project 1 group assignments

Wed Lecture

  • shiny dashboards with Quarto
  • Get all the details about Project 1

Live Coding… Together

  • You are going to do some live coding with me.
    • If you miss a step, get stuck, or just need some help, raise your hand and Chris will come help, or type your question into the #in-class Slack channel.
  • If you do miss anything:
    • I will post the app we create today on Github.

Interactivity with shiny

shiny: Framework for creating web applications

Main Components

In the example apps,

  • what features of the apps did we interact with? And,
  • what changed based on our selections?
  • Inputs: What user manipulates
    • Text
    • Sliders
    • Dropdown menus
    • Action buttons
  • Output: What changes based on user’s selections
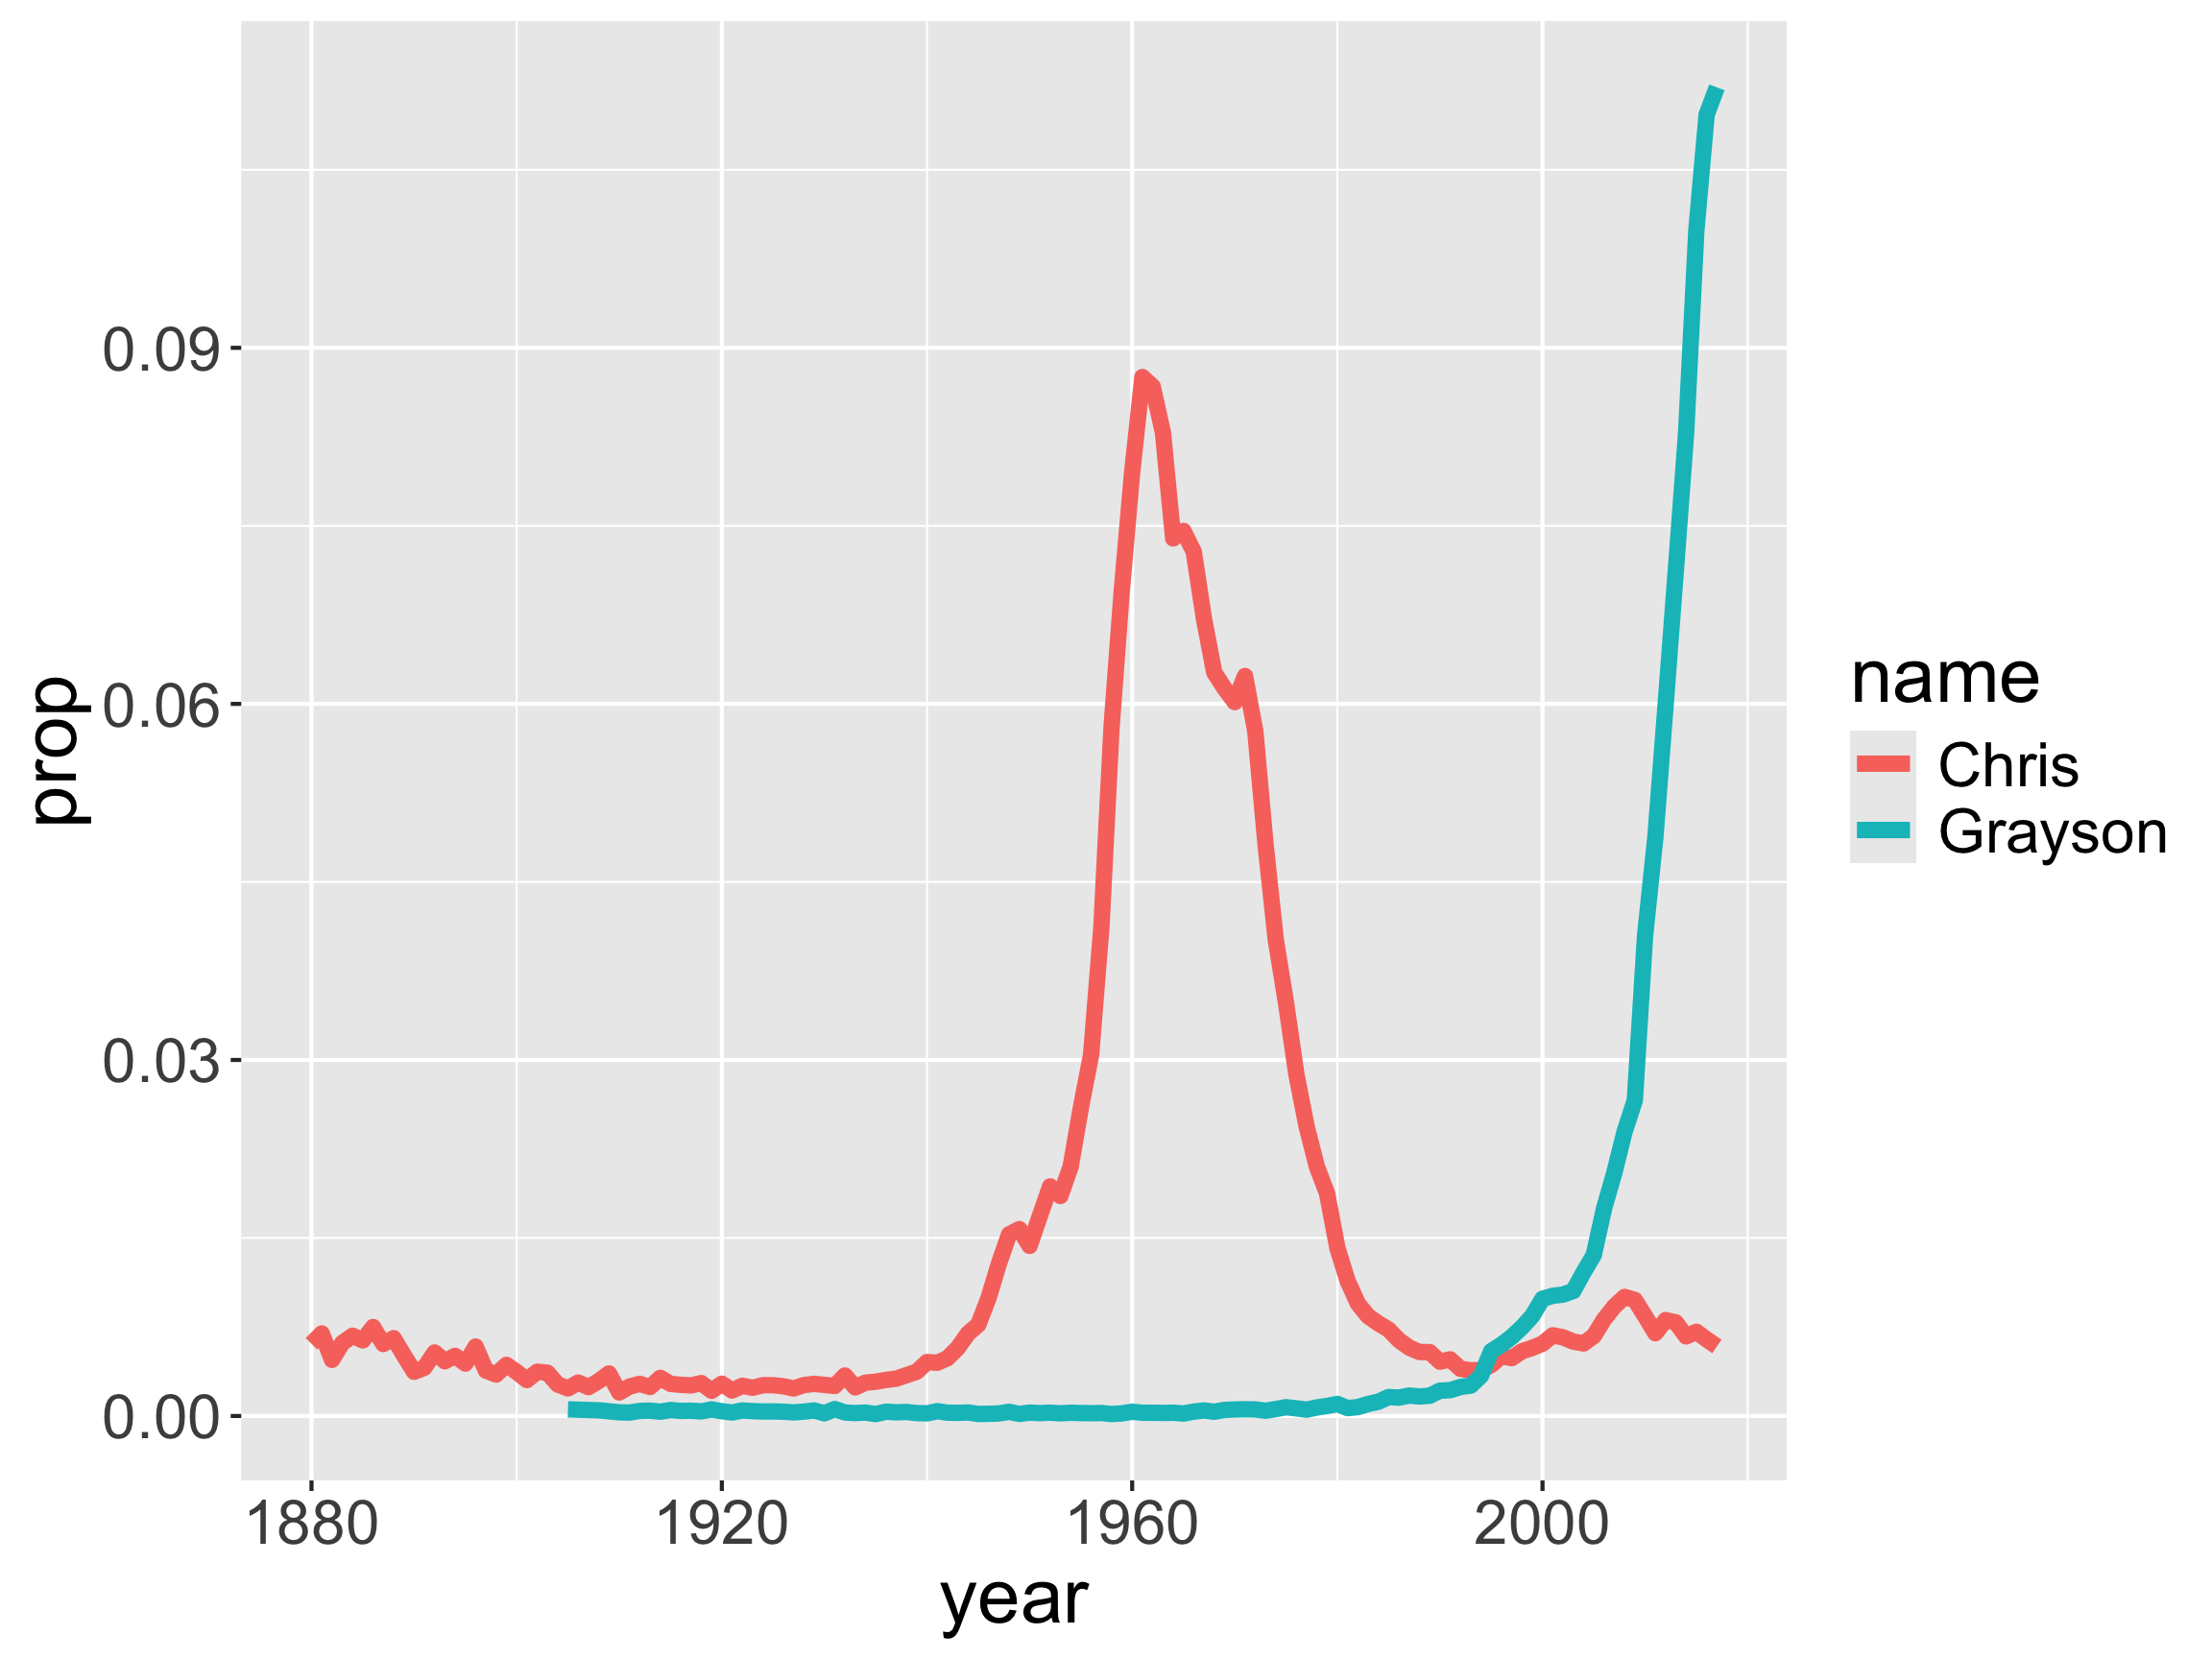
    • Graphs
    • Maps
    • Tables
    • Text
  • Use reactive programming
    • Update outputs when inputs change

Main Components

  • UI: User interface
    • Defines how your app looks
  • Server function
    • Defines how your app works
library(shiny)

# User interface
ui <- fluidPage()

# Server function
server <- function(input, output){}

# Creates app
shinyApp(ui = ui, server = server)

App Building Workflow

Starting a New App:

  • For today and Wednesday, clone the repo “Reed-Data-Science/learn-shiny”
  • Within the “ShinyApps” folder, there is a folder called “my_first_app”.
  • You will see a script file (not a .qmd) called “app.r” within the “my_first_app” folder.
  • Following this folder and file structure is best practice for creating shiny apps.

Revising an App:

  • Write some code in “app.r”.
  • Click “Run App”.
    • Notice what happens in the console.
  • Experiment with the app.
  • Stop the app.
  • Repeat.

Good habit early on:

  • Write static code somewhere (in a .r or .qmd) before you start the app.
    • Modify to be reactive when put in “app.r”.

Let’s practice together!

First App

We want to create an app where someone can type in names from Math 241 and see how their popularity compares.

  • First write some static code that works.
library(tidyverse)

# Smaller dataset
babynames241 <- read_csv("data/babynames_math241.csv")

names <- c("Grayson", "Chris")

dat_names <- babynames241 %>%
  group_by(year, name) %>%
  summarize(n = sum(n)) %>%
  group_by(year) %>%
  mutate(prop = n/sum(n)) %>%
  filter(name %in% names) 

tail(dat_names)
# A tibble: 6 × 4
# Groups:   year [3]
   year name        n    prop
  <dbl> <chr>   <dbl>   <dbl>
1  2015 Chris     573 0.00709
2  2015 Grayson  8071 0.0999 
3  2016 Chris     519 0.00645
4  2016 Grayson  8817 0.110  
5  2017 Chris     459 0.00586
6  2017 Grayson  8767 0.112  

First App

We want to create an app where someone can type in names from Math 241 (or any names) and see how their popularity compares.

  • Input:
    • Text
  • Output:
    • Graph
ggplot(data = dat_names,
       mapping = aes(x = year,
                     y = prop,
                     color = name)) +
  geom_line(linewidth = 2)

Base Components

library(shiny)

# User interface
ui <- fluidPage()

# Server function
server <- function(input, output){}

# Creates app
shinyApp(ui = ui, server = server)

Libraries

  • Make sure to put all the necessary libraries at the top of your app.R file.
    • Don’t include calls to install.packages(), though.
    • Like qmds, our apps must be self-contained.
# Libraries
library(shiny)
library(tidyverse)

Setting up the Room

The ui functions generate HTML code for the web page.

  • fluidPage(): Layout function
  • titlePanel(): Adds title
  • sidebarLayout(): Splits app into side panel and main panel.

Source: Dean Attali

Setting up the Room

The ui functions generate HTML code for the web page.

  • fluidPage(): Layout function
  • titlePanel(): Adds title
  • sidebarLayout(): Splits app into side panel and main panel.
# User interface
ui <- fluidPage(
  titlePanel(title = "Insert title"),
  sidebarLayout(
    sidebarPanel(
    ),
    mainPanel(
    )
  )
)

Input: Text

textInput(): Allow user to interact with the app by providing text

# User interface
ui <- fluidPage(
  titlePanel("Which Math 241 name is most popular?"),
  sidebarLayout(
    sidebarPanel(
      # Create a text input widget
      textInput(inputId = "names",
               label = "Enter Math 241 names here",
               value = "Grayson"),
      p("Put a single space between the names.")
    ),
    mainPanel(
      
    )
  )
)

Output: Graph

plotOutput(): Tells Shiny where to render the graph.

# User interface
ui <- fluidPage(
  titlePanel("Which Math 241 name is most popular?"),
  sidebarLayout(
    sidebarPanel(
      # Create a text input widget
      textInput(inputId = "names",
               label = "Enter Math 241 names here",
               value = "Grayson"),
      p("Put a single space between the names.")
    ),
    mainPanel(
      plotOutput(outputId = "graph")
    )
  )
)

UI Controls

All these UI functions are just a way for us to generate HTML (without needing to learn HTML).

textInput(inputId = "names",
          label = "Enter Math 241 names here",
          value = "Grayson")

Bringing it to Life!

Two important arguments for the server() function:

  • input is a named list that controls the input widgets.
    • EX: input$names controls the textInput() widget
  • output is a named list that controls the objects to display.
    • EX: output$graph
server <- function(input, output){
}

Bringing it to Life!

server <- function(input, output){
  
  output$graph <- renderPlot({
    dat_names <- babynames %>%
      group_by(year, name) %>%
      summarize(n = sum(n)) %>%
      group_by(year) %>%
      mutate(prop = n/sum(n)) %>%
      filter(name %in% c(unlist(str_split(input$names, " "))),
             year >= 1980) 
    
    ggplot(data = dat_names, 
           mapping = aes(x = year, y = prop,color = name)) +
  geom_line(linewidth = 2)
  })
}

First App!

  • Let’s make sure we got all the pieces into our app and then interact with it.

  • Questions?

Let’s Add One More Output

server <- function(input, output){
  
  output$graph <- renderPlot({
 ...
  
    })
  
  output$table <-  renderDT({
    
    dat_names <- babynames %>%
      group_by(year, name) %>%
      summarize(n = sum(n)) %>%
      group_by(year) %>%
      mutate(prop = n/sum(n)) %>%
      filter(name %in% c(unlist(str_split(input$names, " "))),
             year >= 1980) 
    
    dat_names %>%
      group_by(name) %>%
      summarize(count = sum(n)) %>%
      arrange(desc(count))
  })
  
}

Need to load the DT package

library(DT)

And also place it in the UI

# User interface
ui <- fluidPage(
  titlePanel("Which Math 241 name is most popular?"),
  sidebarLayout(
    sidebarPanel(
      # Create a text input widget
      textInput(inputId = "names",
               label = "Enter Math 241 names here",
               value = "Grayson"),
      p("Put a single space between the names.")
    ),
    mainPanel(
      plotOutput(outputId = "graph"),
      DTOutput(outputId = "table")
    )
  )
)

Reactive Expressions

  • How is our code redundant?

  • Let’s try to fix it!

  • Can’t create a static data frame.

    • Need it to be reactive!

Reactive Expressions

  dat_names <- reactive({ 
    babynames %>%
    group_by(year, name) %>%
    summarize(n = sum(n)) %>%
    group_by(year) %>%
    mutate(prop = n/sum(n)) %>%
    filter(name %in% c(unlist(str_split(input$names, " "))),
           year >= 1980) 
  })


Call reactive expressions like you would a function with no arguments.

  output$graph <- renderPlot({
    ggplot(data = dat_names(), 
           mapping = aes(x = year, y = prop, color = name)) +
      geom_line(linewidth = 2)
  })

Detour: Clean Up the DataTable

  dat_names_agg <- reactive({ 
    dat_names() %>%
      group_by(name) %>%
      summarize(count = sum(n)) %>%
      arrange(desc(count))
  })
    
  output$table <-  renderDT({
     datatable(dat_names_agg(), 
              options = list(paging = FALSE,
                             searching = FALSE,
                             orderClasses = TRUE))

  })

Input Widgets

  • Let’s practice with:
    • radioButtons()
    • sliderInput()
    • actionButton() + eventReactive()
    • selectizeInput()

radioButtons()

  • Within the ui:
radioButtons(
  inputId = "variable",
  label = "Variable of Interest",
  choices = c("n", "prop"),
  selected = "prop"
)


  • Within the server() function:
  output$graph <- renderPlot({
    
    ggplot(data = dat_names(), 
         mapping = aes(x = year, y = .data[[input$variable]],
                       color = name)) +
      geom_line(linewidth = 2)
  })

sliderInput()

  • Within the ui:
sliderInput(
  "year_range",
  "Range of Years:",
  min = min(babynames$year),
  max = max(babynames$year),
  value = c(1980, 2010)
)


  • Within the server() function:
  dat_names <- reactive({ 
    babynames %>%
      group_by(year, name) %>%
      summarize(n = sum(n)) %>%
      group_by(year) %>%
      mutate(prop = n/sum(n)) %>%
      filter(name %in% c(unlist(str_split(input$names, " "))),
             year >= input$year_range[1], 
             year <= input$year_range[2]) 
  })

sliderInput()

  • Within the ui:
sliderInput(
  "year_range",
  "Range of Years:",
  min = min(babynames$year),
  max = max(babynames$year),
  value = c(1980, 2010),
  sep = ""
)

Controlling the Timing of Evaluation: actionButton()

  • This causes all input on the page to not send updates to the server until the button is pressed.

  • Within the ui:

actionButton("update", "Update Results!")


  • Within the server:
  dat_names <- eventReactive(input$update, {
    babynames  %>%
      filter(name %in% c(unlist(str_split(input$names, " "))),
             year >= input$year_range[1], 
             year <= input$year_range[2])
  })
  • Why does the radio button still change the graph??

Controlling the Timing of Evaluation: actionButton()

  dat_names <- eventReactive(input$update, {
    babynames  %>%
      filter(name %in% c(unlist(str_split(input$names, " "))),
             year >= input$year_range[1], 
             year <= input$year_range[2])  %>%
      mutate(y_var = .data[[input$variable]])
  })
  
  y_label <- eventReactive(input$update, input$variable)  

  output$graph <- renderPlot({
    ggplot(data = dat_names(), 
           mapping = aes(x = year, 
                         y = y_var,
                         color = name)) +
      geom_line(linewidth = 2) +
      labs(y = y_label())
  })

selectizeInput()

  • Within the ui:
      selectizeInput(inputId = "names",
                label = "Enter Math 241 names here",
                choices = NULL,
                multiple = TRUE)


  • Within the server() function:
server <- function(input, output, session){
  
  updateSelectizeInput(session, 'names', 
                       choices = unique(babynames$name), 
                       server = TRUE)
  
}

Building Outputs

Server-side:

  • Save the object with output$___.

  • Use a render___({}) function to create the object.

  • Access inputs with input$___.

UI-side:

  • Place output with ___Output().

Next Steps

Troubleshooting common issues:

  • Must comma separate all the elements in the ui.
  • But don’t add a comma after the last element in the ui.

Up Next on Wednesday:

  • Uploading apps to www.shinyapps.io
  • shiny with leaflet maps
  • Displaying the code in your app
  • Modifying the layout and adding HTML components
  • Quarto-based shiny dashboards
  • More practice